I've recently been looking into the feasability of a small API to continuously aggregate the prices of symbols accross multiple crypto exchanges. I often find myself trading on lower liquidity exchanges to profit from wider spreads, but that brings the challenge of knowing what is the "true" price of the symbol I'm trading.
Public aggregator services usually have strict rate-limiting, and even when paying for a premium service latencies are sub-optimal. For example, CoinGecko claims a 5 second latency for its highest priced tier.
Read on to explore the feasability of collecting real-time data in order to provide an aggregated true price!
The notebook used to generate the graphs in this post can be interactively explored here.
Never miss a new post
Data collection
This experiment uses CCXT and its watch_ticker websocket endpoint to stream the last
price. The frequency of updates depends on the exchange itself. In a subsequent post,
I'll dig into using the mid price from the order book streams as an aggregate price.
The data was collected over 2 days on 5 symbols: AAVE/USDT, BTC/USDT, COMP/USDT, CRV/USDT and ETH/USDT. These symbols were picked semi-arbitrarily (ETH, BTC and 3 smaller-cap tokens). You can download the input data here.
Initial analysis
The initial analysis was meant to identify zones of relevant information. E.g. high activity, or specific exchange behavior, throughout the dataset's duration.
For this overview purpose, the last price per symbol per exchange is downsampled to 5 minute intervals. Here is BTC/USDT as an example:
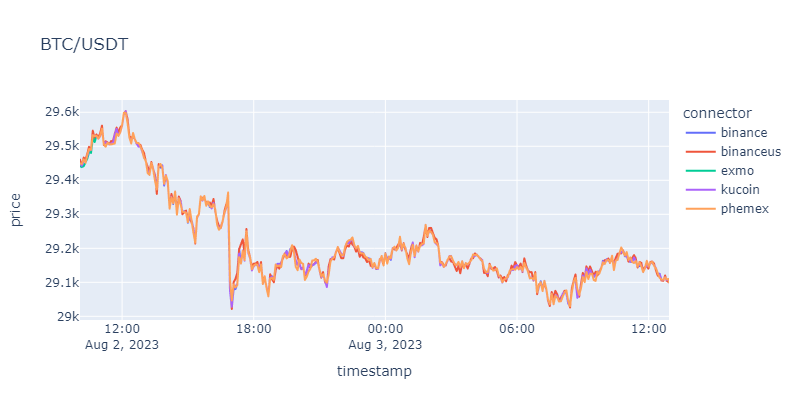
BTC/USDT last price accross 5 exchanges over 2 days. Downsampled to 5 minutes intervals.
You can interactively explore these graphs here
Observations
(1) Latency varies by exchange, DB insertion could use some optimization
Latency depends heavily on the physical distance to the exchange's servers. I anticipated North American exchanges to be quicker (Kraken, Coinbase & Crypto.com), as the script was running on my local network here in eastern Canada. As a tooling experiment, I measured 2 latencies:
- the latency between the timestamp provided by the server and when the script received the websocket message
- the latency between the message reception and the insertion timestamp in a TimescaleDB database
1. Exchange latency
The first latency checks the reliability of each exchanges at delivering updates, and the floor network latency. There isn't much that can be done here to improve the performance. However, including the latency in an eventual true mid/last price might be beneficial.
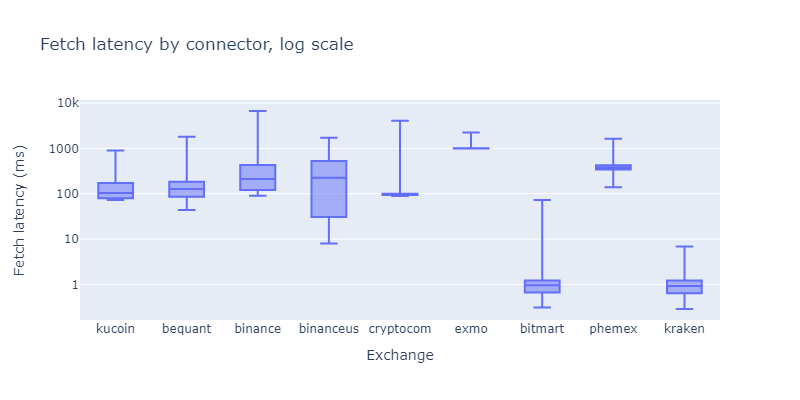
The latency between exchange-stamped timestamp and the timestamp at which the message was received.
One interesting experiment would be to compare websocket message timestamps with historical data timestamps. Are the websocket timestamps delayed versus what exchanges store as historical data?
For example, Bitmart and Kraken show that the exchange latency is at a median of 1ms. I find it highly unlikely to receive messages on my local network with such ridiculously low latency.
2. Database insertion latency
The second latency is an experiment on the floor latency to expect between end-client and an eventual API that serves this data.
There doesn't seem to be a correlation between market activity and DB insertion performance. Instead, it seems an overall optimization would be in order to reduce the 95th percentile and max values that are unnaceptably high at over 100ms.
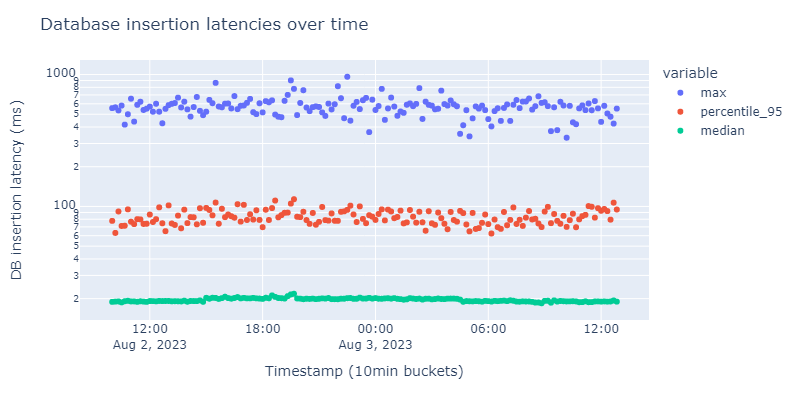
Latency median, 95th percentile and max over time in 10 minute buckets.
(2) Last price is a trailing price
One immediately obvious issue is that exchanges with low trading activity boast a last price that can be far from the apparent price of the market as a whole. This is because the last price trails the actual exchange's order book.
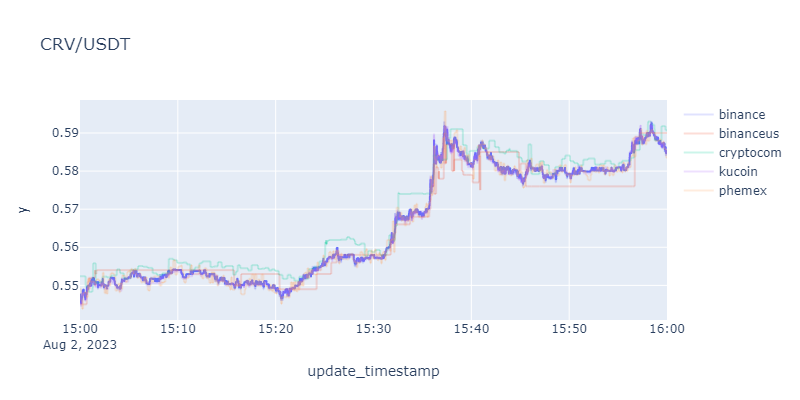
Although no trades happen, the market bid/ask orders are moving around as market makers adjust their spreads. Take a look at binanceus with CRV/USDT:
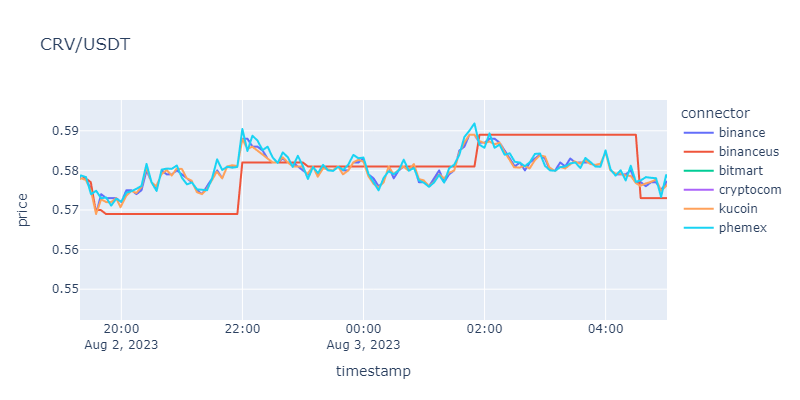
Notice how binanceus last price is static for long periods of time, and then "corrects" itself to the mean of other exchanges at that moment.
When trades happen on binanceus, they simply adjust to the current approximate mean price of other exchanges. Most likely than not, the spreads are continuously following the true price even though no trades happen.
(3) Cryto.com websockets were disconnected
Cryto.com only has data for CRV/USDT for about 6 hours. There were no retries nor monitoring during the data collection of this experiment. It might be wise to have fallback sockets, and obviously automated reconnection mechanisms.
Computing a "true" last price
Onto the meat of the experiment!
A possible "true" last price was computed here using a weighted average. I focused my efforts on a small window with high volatility on the CRV/USDT symbol.
The weights of each connector was computed using the whole dataset1. The logic is simple and not optimized:
- We compute the change in price between successive updates of each exchange
- We remove any 0 diff updates (some exchanges send updates regardless, others don't)
- The weight of the exchange is the inverse of the variance of the absolute values of those diffs
The rationale is that an exchange with many tight trades will have a small variance (bigger weight). An exchange with sparser, wider trades will have a higher variance (smaller weight).
The "true" last price of CRV/USDT in a one hour window with high volatility
I highly recommend you explore this graph interactively and look at how the true price behaves when there are sharp movements.
Next steps
The major shortfall of the experiment presented here is in the usage of the last price instead of using the bid/ask of each exchange. The next iteration will definitely use the mid price as a basis for calculation, as it provides many advantages:
- No lag between what the market makers think the price is versus the last price
- The spread and frequency of trades is a better exchange weighing indicator than an arbitrary variance-based calculation
Moreover, adding trades data would provide the volume as an additionnal weighing indicator: the more volume an exchange has, the higher its impact on the true price.
Other ideas
- De-crossing pairs to compute a true price accross USD-USDT pairs for example
Footnotes
-
In a real-time application the weights could be updated at a regular interval like one hour using trailing data from the last week. ↩